What's that?
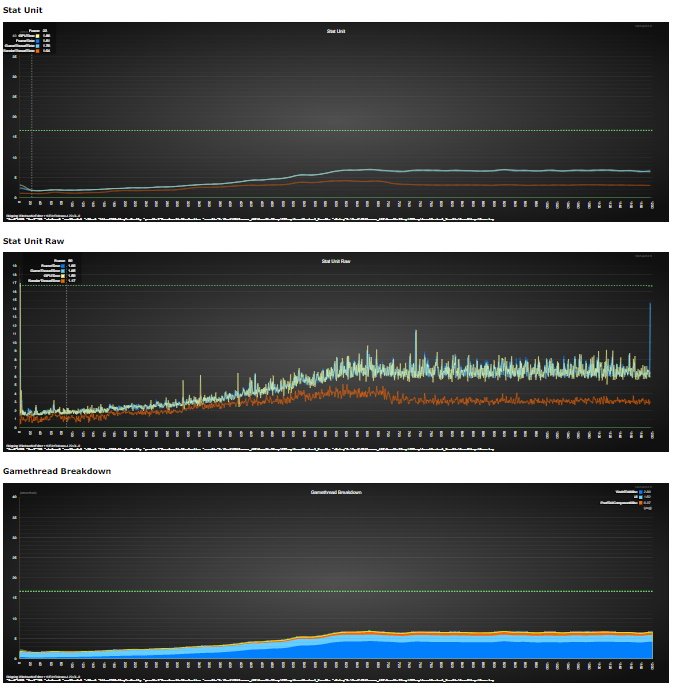
The CSV Profiler in Unreal Engine is a tool that helps you measure and analyze the performance of your game. It records various performance metrics and saves them in a CSV (Comma-Separated Values) file, which you can open in a spreadsheet program like Excel. And after the capture has been made, it can automatically parse it and create nice looking graphs.

Performance and Memory considerations
Instrumentation overhead is designed to be as low as possible, enabling you to instrument functions which are called hundreds of times per frame with minimal distortion of the timing data. There is minimal processing of stat data, such as accumulation of timings in thread-local blocks, and these are only processed at the end of the capture.
Raw stat data is processed every 60ms (by default) to reduce memory overhead. The resulting overhead during profiling is 4 bytes per stat per frame and accumulates until the capture ends since nothing is written to disk until that point. This means that memory may become a concern for very long captures with large numbers of stats. Memory usage is summarised to the log at the end of a capture.
How to use it
While in game, in the console type csvprofile start and it will start frame capture.

On the left side you’ll see the counter that shows the amount of frames captured already.

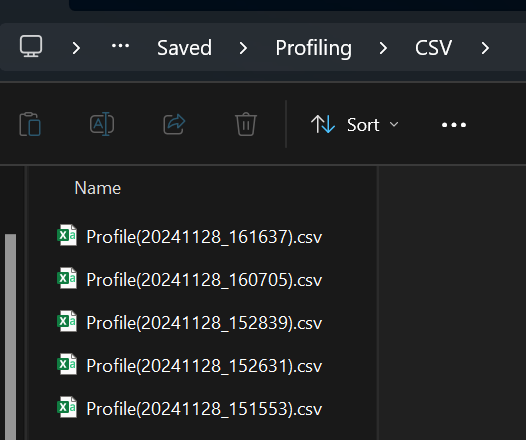
When you want to stop, type csvprofile stop. After that, you can find your ready-to-use CSV in the game folder. _pathToProject_/Saved/Profiling/CSV/

Let's make some graphs!
With CSV you can either create your own parser and make your own visualizers. Or you have a choice of using Perfreporttool.exe that’s shipped with Unreal Engine. This part is about shipped solution. The tool lives under the CSVTools package which is situated at Engine\Binaries\DotNET\CsvTools.
Most probably the tool is already built for you, but if it’s not, look under the spoiler.
If it's not built
- Copy the directory under Engine\Source\Programs.
- Inside you should see a CSVTools.sln, open it.
- Select Release from the configuration box and click on Build -> Rebuild Solution
This should put the binaries under Engine\Binaries\DotNET\CsvTools.
Building graphs
- Navigate to the
Engine\Binaries\DotNET\CsvTools. - Open your terminal/powershell in this directory.
- Command will consist from: tool exe file and the path to the CSV file
./PerfreportTool.exe "PathToYourCSV".
It will generate an HTML file with graphs in the CsvTools folder.
If you want to specify the output folder, then you need to use named arguments.
./PerfreportTool.exe -csv "pathToYourCSV" -o "pathToDesiredOutputDirectory"

How to make markers in code
Stat Categories
You can define a stat category with
CSV_DEFINE_CATEGORY(CategoryName, bEnableByDefault).

You can use an existing category externally with
CSV_DECLARE_CATEGORY_EXTERN(CategoryName)

There are _MODULE variants of this for cross-module usage.
Ideally only key stats should be enabled by default. Plan carefully before making new categories enabled by default, and avoid adding stats to existing categories which are enabled by default unless they're really needed.
Adding Stats
Unit stats and free memory have built-in instrumentation, but you can add your own additonal stats to capture using the CSV_ macros. The CSV_ macros are defined at the top of CsvProfiler.h. You can add the following types of stats:
- Scoped timing stats - CSV_SCOPED_TIMING_STAT(Category, StatName)
- Custom (value) stats - CSV_CUSTOM_STAT(Category, StatName,Value, Op) or its variants

Op is a stat operation enum (ECsvCustomStatOp), which can be one of: Set, Min, Max, Accumulate
Stats can be added inline and do not need to be defined up front. However, you can define them up front if needed. See the CSV_DEFINE_STAT(Category,StatName) and CSV_CUSTOM_STAT_DEFINED macros.
Stats get accumulated on a per-frame basis and written out to a CSV, where each row is a frame, and each column is a stat. They appear as headings in the CSV with CategoryName/StatName, or CategoryName/ThreadName/StatName for timer stats.
Events
Events can be added with the CSV_EVENT macro which uses the same parameters as printf. Events appear in a special events column in the CSV, separated with semicolons if there are multiple events in a frame. The CSVToSVG graphing tool can be used to annotate graphs with events using the -showevents parameter. See CSVToSVG Tool for more information.
You should try to use events sparingly to capture infrequent occurances. Overuse of events can result in high performance and memory overhead.
GPU Stats
The CSV profiler supports GPU Stats, including in Test builds where STATS is disabled.
Recording GPU stats carries some overhead, so it's disabled by default.
To enable recording GPU stats, do one of the following:
Set r.GPUCsvStatsEnabled to 1 in the console.
Pass -csvGpuStats on the command line.
Commands glossary
In-game commands
csvprofile Start - start recording.
csvprofile Stop - stops recording.
csvprofile frames=N - can capture a fixed number of frames.
Perfreporttool arguments
Format
tool.exe -input -output
Input
-csv <filename> or -csvdir <directory path> or -summaryTableCacheIn <directory path>
or
-csvList <comma separated> or -prcList <comma separated>
Output directory (will be created if necessary)
-o <dir name>
Optional Args:
-reportType <e.g. flythrough, playthrough, playthroughmemory>
-reportTypeCompatCheck : do a compatibility if when specifying a report type (rather than forcing)
-graphXML <xmlfilename>: custom format of the dashboard.
-reportXML <xmlfilename>: custom format of the report.
-reportxmlbasedir <folder>
-title <name>: title for detailed reports.
-summaryTitle <name>: title for summary tables.
-maxy <value>: forces all graphs to use this value.
-writeSummaryCsv: if specified, a csv file containing summary information will be generated. Not available in bulk mode.
-noWatermarks: don't embed the commandline or version in reports.
-cleanCsvOut <filename>: write a standard format CSV after event stripping with metadata stripped out. Not available in bulk mode.
-noSmooth: disable smoothing on all graphs.
-listSummaryTables: lists available summary tables from the current report XML.
-dumpVariables | -dumpVariablesAll: dumps variables to the log for each CSV (all includes metadata).
Performance args:
-perfLog: output performance logging information.
-graphThreads: use with -batchedGraphs to control the number of threads per CsvToSVG instance (default: PC core count/2).
-csvToSvgSequential: Run CsvToSvg sequentially.
-useEmbeddedGraphUrl: Insert a script to fetch the graph from the specified endpoint on page load rather than embedding the full graph.
-embeddedGraphUrlRoot: The url to fetch the graph from if -useEmbeddedGraphUrl is specified. CsvToSvg graph args are provided as get params.
Options to truncate or filter source data:
Warning: these options disable Summary Table caching
-minx <frameNumber>
-maxx <frameNumber>
-beginEvent <event>: strip data before this event.
-endEvent <event>: strip data after this event.
-noStripEvents: if specified, don't strip out samples between excluded events from the stats.
Optional bulk mode args:
(use with -csvdir, -summaryTableCacheIn, -csvList, -prcList)
-recurse
-searchpattern <pattern>: e.g -searchpattern csvprofile*
-customTable <comma separated fields>
-customTableSort <comma separated field row sort order>: (use with -customTable)
-noDetailedReports: skips individual report generation.
-collateTable: writes a collated table in addition to the main one, merging by row sort.
-collateTableOnly: as -collateTable, but doesn't write the standard summary table.
-emailTable: writes a condensed email-friendly table (see the 'condensed' summary table).
-csvTable: writes the summary table in CSV format instead of html.
-summaryTableXML <XML filename>
-summaryTable <name>: Selects a custom summary table type from the list in reportTypes.xml (if not specified, 'default' will be used).
-condensedSummaryTable <name> : Selects a custom condensed summary table type from the list in reportTypes.xml (if not specified, 'condensed' will be used).
-summaryTableFilename <name>: use the specified filename for the summary table (instead of SummaryTable.html)
-metadataFilter <query> or <key0=value0,key1=value1...>: filters based on CSV metadata(e.g "platform=ps4 AND deviceprofile=ps4_60").
-readAllStats: allows any CSV stat avg to appear in the summary table, not just those referenced in summaries.
-showHiddenStats: shows stats which have been automatically hidden (typically duplicate csv unit stats).
-spreadsheetfriendly: outputs a single quote before non-numeric entries in summary tables.
-noSummaryMinMax: don't make min/max columns for each stat in a condensed summary.
-reverseTable [0|1]: Reverses the order of summary tables (set 0 to force off).
-scrollableTable [0|1]: makes the summary table scrollable, with frozen first rows and columns (set 0 to force off).
-colorizeTable [off|budget|auto]: selects the table colorization mode. If omitted, uses the default in the summary xml table if set.
-maxSummaryTableStringLength <n>: strings longer than this will get truncated
-allowDuplicateCSVs: doesn't remove duplicate CSVs (Note: can cause summary table cache file locking issues).
-requireMetadata: ignores CSVs without metadata
-listFiles: just list all files that pass the metadata query. Don't generate any reports.
-reportLinkRootPath <path>: Make report links relative to this
-csvLinkRootPath <path>: Make CSV file links relative to this
linkTemplates: insert templates in place of relative links that can be replaced later (e.g {LinkTemplate:Report:<CSV ID>}).
-weightByColumn: weight collated table averages by this column (overrides value specified in the report XML).
-noWeightedAvg: Don't use weighted averages for the collated table.
-minFrameCount <n>: ignore CSVs without at least this number of valid frames.
-maxFileAgeDays <n>: max file age in days. CSV or PRC files older than this will be ignored.
-summaryTableStatThreshold <n> : stat/metric columns in the summarytable will be filtered out if all values are less than the threshold.
-summaryTableXmlSubst <find1>=<replace1>,<find2>=<replace2>...: replace summarytable XML row and filter entries.
-summaryTableXmlAppend <list,of,stats>: append these stats to the summary table's filter list.
-summaryTableXmlRowSortAppend <list,of,stats>: append these stats to the summary table's row sort list.
-transposeTable: write the summary tables transposed.
-transposeCollatedTable: write the collated summary table transposed (disables min/max columns).
Diff rows
-addDiffRows: adds diff rows after the first two rows.
-sortColumnsByDiff: sorts columns by the max of its diff scores (use with -addDiffRows). Notes: Diff score corresponds to the value of a column's diff row; the sign is reversed if LowIsBad. Stats are sorted by prefixes first, e.g GPU.
-columnDiffDisplayThreshold <value>: if specified, hides columns with max diff value below this threshold
Optional Column Filters.
-debugShowFilteredColumns: grays out filtered columns instead of removing. Column tooltip will show filtered reason.
-hideMetadataColumns: filters out metadata columns from the table (excluding those used in row sort).
Regression Column Filtering.
-onlyShowRegressedColumns: enables regression filtering. Only shows columns where the most recent row group (see -regressionJoinRowsByName) is outside the given stddiv threshold from the mean of the previous rows.
-regressionJoinRowsByName <statName>: a stat name to join rows by for aggregation. (default: no aggregation).
-regressionStdDevThreshold <n> (default = 2): the stddiv threshold for filtering.
-regressionOutlierStdDevThreshold <n> (default = 4): stddiv threshold for outliers (these are ignored).
JSON serialization
-summaryTableToJson <path>: path (usually a json filename) to write summary table row data to.
-summaryTableToJsonSeparateFiles: writes separate files. -summaryTableToJson specifies the directory name.
-summaryTableToJsonFastMode: exit after serializing json data (skips making summary tables).
-summaryTableToJsonWriteAllElementData: write all element data, including tooltips, flags.
-summaryTableToJsonMetadataOnly: only write CsvMetadata elements to json.
-summaryTableToJsonFileStream: use a file stream to write Json. Experimental but can avoid OOMs.
-summaryTableToJsonNoIndent: don't indent json output files.
-jsonToPrcs <json filename>: write PRCs. PRC files will be written to -summaryTableCache folder.
Performance args for bulk mode
-precacheCount <n>: number of CSV files to precache in the lookahead cache (0 for no precache).
-precacheThreads <n>: number of threads to use for the CSV lookahead cache (default 8).
-summaryTableCache <dir>: specifies a directory for summary table data to be cached. This avoids processing CSVs on subsequent runs when -noDetailedReports is specified.
-summaryTableCacheInvalidate: regenerates summary table disk cache entries (ie write only).
-summaryTableCacheReadOnly: only read from the cache, never write.
-summaryTableCachePurgeInvalid: Purges invalid PRCs from the cache folder.
-summaryTableCacheIn <dir>: reads data directly from the summary table cache instead of from CSVs.
-summaryTableCacheUseOnlyCsvID: only use the CSV ID for the summary table cacheID, ignoringthe report type hash.
Use this if you want to avoid cache data being invalidated by report changes
-noCsvCacheFiles: disables usage of .csv.cache files. Cache files can be much faster if filtering on metadata.
